Detailed file descriptions
This document present the specifications of the CAPS format version 1.0.0.
Versions of Clinica, BIDS, and CAPS specifications
| Clinica version | BIDS version supported | CAPS version supported |
|---|---|---|
| 0.9.x | 1.7.0 | 1.0.0 |
| 0.8.x | 1.7.0 | no version |
File dataset_description.json
For any question about this file see this section in our BIDS specifications.
Subjects and Groups folders
In the following, brackets [/] will denote optional key/value pairs in the filename, while accolades {/} will indicate a list of compulsory values (e.g. hemi-{left|right} means that the key hemi only accepts left or right as values).
Finally:
participant_iddenotesparticipant-<participant_label>;session_iddenotessession-<session_label>;group_iddenotesgroup-<group_label>;long_iddenoteslong-<long_label>.
T1 MRI data
t1-linear - Affine registration of T1w images to the MNI standard space
dataset_description.json
subjects/
└─ <participant_id>/
    └─ <session_id>/
      └─ t1_linear/
         ├─ <source_file>_space-MNI152NLin2009cSym_res-1x1x1_affine.mat
         ├─ <source_file>_space-MNI152NLin2009cSym_res-1x1x1_T1w.nii.gz
         └─ <source_file>_space-MNI152NLin2009cSym_desc-Crop_res-1x1x1_T1w.nii.gz
The desc-Crop indicates images of size 169×208×179 after cropping to remove the background.
t1-volume pipeline - Volume-based processing of T1-weighted MR images
Segmentation
dataset_description.json
subjects/
└─ <participant_id>/
   └─ <session_id>/
      └─ t1/
         └─ spm/
            └─ segmentation/
               ├─ normalized_space/
               │  ├─ <source_file>_target-Ixi549Space_transformation-{inverse|forward}_deformation.nii.gz
               │  ├─ <source_file>_segm-<segm>_space-Ixi549Space_modulated-{on|off}_probability.nii.gz
               │  └─ <source_file>_space-Ixi549Space_T1w.nii.gz
               ├─ native_space/
               │  └─ <source_file>_segm-<segm>_probability.nii.gz
               └─ dartel_input/
                  └─ <source_file>_segm-<segm>_dartelinput.nii.gz
- The
modulated-{on|off}key indicates if modulation has been used in SPM to compensate for the effect of spatial normalization. - The possible values for the
segm-<segm>key/value are:graymatter,whitematter,csf,bone,softtissue, andbackground. - The T1 image in
Ixi549Space(reference space of the TPM) is obtained by applying the transformation obtained from the SPM segmentation routine to the T1 image in native space.
DARTEL
dataset_description.json
groups/
└─ <group_id>/
   ├─ <group_id>_subjects_visits_list.tsv
   └─ t1/
      ├─ <group_id>_iteration-<index>_template.nii.gz
      └─ <group_id>_template.nii.gz
- The final group template is
<group_id>_template.nii.gz. - The
<group_id>_iteration-<index>_template.nii.gzobtained at each iteration will only be used when obtaining flow fields for registering a new image into an existing template (SPM DARTEL existing templates procedure).
Note for SPM experts
The original name of <group_id>_iteration-<index>_template.nii.gz is Template<index>.nii.
DARTEL to MNI
dataset_description.json
subjects/
└─ <participant_id>/
   └─ <session_id>/
      └─ t1/
         └─ spm/
            └─ dartel/
               └─ <group_id>/
                  ├─ <source_file>_target-<group_label>_transformation-forward_deformation.nii.gz
                  └─ <source_file>_segm-<segm>_space-Ixi549Space_modulated-{on|off}[_fwhm-<X>mm]_probability.nii.gz
Atlas statistics
dataset_description.json
subjects/
└─ <participant_id>/
   └─ <session_id>/
      └─ t1/
         └─ spm/
            └─ dartel/
               └─ <group_id>/
                  └─ atlas_statistics/
                     └─ <source_file>_space-<space>_map-graymatter_statistics.tsv
Statistics files (with _statistics.tsv suffix) are detailed in appendix.
t1-freesurfer - FreeSurfer-based processing of T1-weighted MR images
The outputs of the t1-freesurfer pipeline are split into two sub-folders, the first one containing the FreeSurfer outputs and a second with additional outputs specific to Clinica.
FreeSurfer outputs:
dataset_description.json
subjects/
└─ <participant_id>/
   └─ <session_id>/
      └─ t1/
         └─ freesurfer_cross_sectional/
            └─ <participant_id>_<session_id>/
               ├─ label/
               ├─ mri/
               ├─ scripts/
               ├─ stats/
               └─ surf/
Clinica additional outputs:
dataset_description.json
subjects/
└─ <participant_id>/
   └─ <session_id>/
      └─ t1/
         └─ freesurfer_cross_sectional/
            └─ regional_measures/
               ├─ <source_file>_parcellation-wm_volume.tsv
               ├─ <source_file>_segmentationVolumes.tsv
               └─ <source_file>_hemi-{left|right}_parcellation-<parcellation>_thickness.tsv
For the file: *_hemi-{left|right}_parcellation-<parcellation>_thickness.tsv, _thickness is just an example for the cortical thickness, we also have other measurements defined in the table below:
| Name | Suffix | Description |
|---|---|---|
| Cortical thickness | _thickness |
Cortical thickness between pial surface and white surface |
| Cortical volume | _volume |
Volume of gray matter |
| Cortical surface area | _area |
Cortical surface area |
| Cortical mean curvature | _meancurv |
Mean curvature of cortical surface |
- The
hemi-{left|right}key/value stands forleftorrighthemisphere. - The possible values for the
parcellation-<parcellation>key/value are:desikan(Desikan-Killiany Atlas),destrieux(Destrieux Atlas) andba(Brodmann Area Maps). - The TSV files for Brodmann areas contain a selection of regions, see this link for the content of this selection: http://ftp.nmr.mgh.harvard.edu/fswiki/BrodmannAreaMaps).
The details of the white matter parcellation of FreeSurfer can be found here: https://surfer.nmr.mgh.harvard.edu/pub/articles/salat_2008.pdf.
Example - Content of the TSV files
Content of sub-CLNC01_ses-M000_T1w_segmentationVolumes.tsv:
Measure:volume  Left-Lateral-Ventricle  Left-Inf-Lat-Vent   ...
/path/to/freesurfer/segmentation/   12345.6 12.334  ...
This file contains the volume of the different subcortical structures after segmentation.
Content of sub-CLNC01_ses-M000_T1w_parcellation-wm_volume.tsv:
Measure:volume  wm-lh-bankssts  wm-lh-caudalanteriorcingulate ...
/path/to/freesurfer/wm parcellation/ 2474.6 1863.7 ...
Content of sub-CLNC01_ses-M000_hemi-left_parcellation-desikan_thickness.tsv:
lh.aparc.thickness  lh_bankssts_thickness   lh_caudalanteriorcingulate_thickness …
/path/to/freesurfer/cortical thickness/parcellation 2.048 2.892 …
t1-freesurfer-longitudinal – FreeSurfer-based longitudinal processing of T1-weighted MR images
FreeSurfer unbiased templates
dataset_description.json
subjects/
└─ <participant_id>/
   └─ <long_id>/
      └─ freesurfer_unbiased_template/
         └─ <participant_id>_<long_id>/
            ├─ label/
            ├─ mri/
            ├─ scripts/
            ├─ stats/
            └─ surf/
FreeSurfer longitudinal outputs
The outputs are split into two sub-folders, the first containing the FreeSurfer longitudinal outputs and a second with additional outputs specific to Clinica.
dataset_description.json
subjects/
└─ <participant_id>/
   └─ <session_id>/
      └─ t1/
         └─ <long_id>/
            └─ freesurfer_longitudinal/
               └─ <participant_id>_<session_id>.long.<participant_id>_<long_id>/
                  ├─ label/
                  ├─ mri/
                  ├─ scripts/
                  ├─ stats/
                  └─ surf/
Clinica additional outputs:
dataset_description.json
subjects/
└─ <participant_id>/
   └─ <session_id>/
      └─ t1/
         └─ <long_id>/
            └─ freesurfer_longitudinal/
               └─ regional_measures/
                  ├─ <participant_id>_<session_id>_<long_id>_parcellation-wm_volume.tsv
                  ├─ <participant_id>_<session_id>_<long_id>_segmentationVolumes.tsv
                  └─ <participant_id>_<session_id>_<long_id>_hemi-{left|right}_parcellation-<parcellation>_thickness.tsv
where each file is explained in the t1-freesurfer subsection.
Note
The naming convention <subject_name>.long.<template_name> is imposed by FreeSurfer.
Diffusion imaging data
dwi-preprocessing-* - Preprocessing of raw diffusion weighted imaging (DWI) datasets
dataset_description.json
subjects/
└─ <participant_id>/
   └─ <session_id>/
      └─ dwi/
         └─ preprocessing/
            ├─ <source_file>_space-<space>_desc-preproc_dwi.bval
            ├─ <source_file>_space-<space>_desc-preproc_dwi.bvec
            ├─ <source_file>_space-<space>_desc-preproc_dwi.nii.gz
            └─ <source_file>_space-<space>_brainmask.nii.gz
The resulting DWI file after preprocessing.
According to the subtype of pipeline run, <space> can be:
A brain mask of the preprocessed file is provided.
dwi-dti - DTI-based processing of corrected DWI datasets
dataset_description.json
subjects/
└─ <participant_id>/
   └─ <session_id>/
      └─ dwi/
         └─ dti_based_processing/
            ├─ native_space/
            │  ├─ <source_file>_space-<space>_model-DTI_diffmodel.nii.gz
            │  ├─ <source_file>_space-<space>_{FA|MD|AD|RD}.nii.gz
            │  └─ <source_file>_space-<space>_DECFA.nii.gz
            │─ normalized_space/
            │  ├─ <source_file>_space-MNI152Lin_res-1x1x1_affine.mat
            │  ├─ <source_file>_space-MNI152Lin_res-1x1x1_deformation.nii.gz
            │  └─ <source_file>_space-MNI152Lin_res-1x1x1_{FA|MD|AD|RD}.nii.gz
            └─ atlas_statistics/
               └─ <source_file>_space-<space>_res-1x1x1_map-{FA|MD|AD|RD}_statistics.tsv
The DTI is saved under the *_model-DTI_diffmodel.nii.gz filename.
The different maps based on the DTI are:
FA: fractional anisotropy.MD: mean diffusivity.AD: axial diffusivity.RD: radial diffusivity.DECFA: directionally-encoded colour (DEC) FA.
Current atlases used for statistics are the 1mm version of JHUDTI81, JHUTract0 and JHUTract25 (see Atlases page for further details).
Statistics files (with _statistics.tsv suffix) are detailed in appendix.
Note
The naming convention for suffixes follows the BIDS derivative specifications except for the statistics files (specific files for our needs) and the _deformation.nii.gz file (it is equivalent to the _warp.nii.gz file in the BEP014 specifications).
dwi-connectome - Computation of structural connectome from corrected DWI datasets
dataset_description.json
subjects/
└─ <participant_id>/
    └─ <session_id>/
        └─ dwi/
            └─ connectome_based_processing/
                ├─ <source_file>_space-{b0|T1w}_model-CSD_diffmodel.nii.gz
                │─ <source_file>_space-{b0|T1w}_model-CSD_tractography.tck
                └─ <source_file>_space-{b0|T1w}_model-CSD_parcellation-{desikan|destrieux}_connectivity.tsv
- The constrained spherical deconvolution (CSD) diffusion model is saved under the
*_model-CSD_diffmodel.nii.gzfilename. - The whole-brain tractography is saved under the
*_tractography.tckfilename. - The connectivity matrices are saved under
*_connectivity.tsvfilenames.
Current parcellations used for the computation of connectivity matrices are desikan and desikan (see Atlases page for further details).
PET imaging data
pet-volume - Volume-based processing of PET images
dataset_description.json
subjects/
└─ <participant_id>/
   └─ <session_id>/
      └─ pet/
         └─ preprocessing/
            └─ <group_id>/
               ├─ <source_file>_space-T1w_pet.nii.gz
               ├─ <source_file>_space-T1w[_pvc-rbv]_pet.nii.gz
               ├─ <source_file>_space-Ixi549Space[_pvc-rbv]_pet.nii.gz
               ├─ <source_file>_space-Ixi549Space[_pvc-rbv]_suvr-<suvr>_pet.nii.gz
               ├─ <source_file>_space-Ixi549Space_brainmask.nii.gz
               └─ <source_file>_space-Ixi549Space[_pvc-rbv]_suvr-<suvr>_mask-brain_pet.nii.gz
dataset_description.json
subjects/
└─ <participant_id>/
   └─ <session_id>/
      └─ pet/
         └─ preprocessing/
            └─ atlas_statistics/
               └─ <source_file>_space-<space>[_pvc-rbv]_suvr-<suvr>_statistics.tsv
- The
_trc-<label>key/value describes the radiotracer used for the PET acquisition (currently supported:18FFDGand18FAV45). - The
[_pvc-rbv]label is optional, depending on whether your image has undergone partial volume correction (region-based voxel-wise (RBV) method) or not. - The possible values for the
suvr-<suvr>key/value are:ponsfor FDG-PET andcerebellumPonsfor different types of amyloid PET.
Statistics files (with _statistics.tsv suffix) are detailed in appendix.
pet-surface - Surface-based processing of PET images
dataset_description.json
subjects/
└─ <participant_id>/
   └─ <session_id>/
      └─ pet/
         └─ surface/
            ├─ atlas_statistics/
            │  └─ <source_file>_trc-<label>_pet_space-<space>_pvc-iy_suvr-<suvr>_statistics.tsv
            ├─ <source_file>_hemi-{left|right}_midcorticalsurface
            └─ <source_file>_hemi-{left|right}_trc-<label>_pet_space-<space>_suvr-<suvr>_pvc-iy_hemi-{left|right}_fwhm-<label>_projection.mgh
- The
trc-<label>key/value describes the radiotracer used for the PET acquisition (currently supported:18FFDGand18FAV45). - The
[_pvc-iy]label describes the partial volume correction used in the algorithm for the projection (Iterative Yang). - The possible values for the
suvr-<suvr>key/value are:ponsfor FDG-PET andcerebellumPonsfor different types of amyloid PET. - The
fwhmrepresents the FWHM (in mm) of the Gaussian filter applied to the data mapped onto the FsAverage surface. The different values are 0 (no smoothing), 5, 10, 15, 20, and 25. - Files with the
_midcorticalsurfacesuffix represent the surface at equal distance between the white matter/gray matter interface and the pial surface (one per hemisphere). - Files with the
projectionsuffix are PET data that can be mapped onto meshes. If_space_fsaverage_is in the name, it can be mapped either onto the white or pial surface of FsAverage. If_space_native_is in the name, it can be mapped onto the white or pial surface of the subject’s surface ({l|r}h.white,{l|r}h.pialfiles fromt1-freesurferpipeline). - Files with the
statisticssuffix are text files that display average PET values on either_space-desikanor_space-destrieuxatlases.
Example of this content can be found in appendix.
pet-surface-longitudinal - Surface-based longitudinal processing of PET images
dataset_description.json
subjects/
└─ <participant_id>/
   └─ <session_id>/
      └─ pet/
         └─ <long_id>/
            └─ surface_longitudinal/
               ├─ atlas_statistics/
               │  └─ sub-<label>_ses-<lalbel>_long-<label>_trc-<label>_pet_space-<space>_pvc-iy_suvr-<suvr>_statistics.tsv
               ├─ sub-<label>_ses-<lalbel>_long-<label>_hemi-{left|right}_midcorticalsurface
               └─ sub-<label>_ses-<lalbel>_long-<label>_trc-<label>_pet_space-<space>_suvr-<suvr>_pvc-iy_hemi-{left|right}_fwhm-<label>_projection.mgh
Explanations on the key/values can be found on the
pet-surface section.
pet-linear - Affine registration of PET images to the MNI standard space
dataset_description.json
subjects/
└─ <participant_id>/
    └─ <session_id>/
      └─ pet_linear/
         ├─ <source_file>_space-T1w_rigid.mat
         ├─ <source_file>_space-T1w_pet.nii.gz
         ├─ <source_file>_space-MNI152NLin2009cSym_res-1x1x1_suvr-<suvr_label>_pet.nii.gz
         └─ <source_file>_space-MNI152NLin2009cSym_desc-Crop_res-1x1x1_suvr-<suvr_label>_pet.nii.gz
The desc-Crop indicates images of size 169×208×179 after cropping to remove the background.
Statistics
statistics-surface - Surface-based mass-univariate analysis with SurfStat
Group comparison
dataset_description.json
groups/
└─ <group_id>/
   └─ statistics/
      ├─ participants.tsv
      └─ surfstat_group_comparison/
         ├─ <group_id>_<group_1>-lt-<group_2>_measure-<measure>_fwhm-<label>_correctedPValue.jpg
         ├─ <group_id>_<group_2>-lt-<group_1>_measure-<measure>_fwhm-<label>_correctedPValue.jpg
         ├─ <group_id>_<group_1>-lt-<group_2>_measure-<measure>_fwhm-<label>_correctedPValue.mat
         ├─ <group_id>_<group_2>-lt-<group_1>_measure-<measure>_fwhm-<label>_correctedPValue.mat
         ├─ <group_id>_participants.tsv
         ├─ <group_id>_output.log
         └─ <group_id>_glm.json
In the case above, _correctedPValue indicates that these are maps of corrected p-values.
Other types of maps include, but are not limited to:
| Name | Suffix | Description |
|---|---|---|
| Corrected p-value | _correctedPValue |
Corrected P-values for vertices and clusters level based on random field theory |
| Uncorrected p-value | _uncorrectedPValue |
Uncorrected P-value for a generalized linear model |
| T-statistics | _TStatistics |
T statistics for a generalized linear model |
| FDR | _FDR |
Q-values for False Discovery Rate of resels |
The <group_1>-lt-<group_2> means that the tested hypothesis is: the measurement of <group_1> is lower than (lt) that <group_2>.
Value for measure can be ct (cortical thickness from t1-freesurfer), fdg (from pet-surface) or user-defined maps.
The value for fwhm corresponds to the size of the surface-based smoothing in mm and can be 5, 10, 15 or 20.
The JPEG files are simple snapshots.
The *.mat files can be read later by tools like PySurfer and Surfstat.
Example
groups/
└─ group-ADvsHC/
   └─ statistics/
      ├─ participants.tsv
      └─ surfstat_group_comparison/
         ├─ group-ADvsHC_AD-lt-HC_measure-ct_fwhm-20_correctedPValue.jpg
         ├─ group-ADvsHC_participants.tsv
         ├─ group-ADvsHC_output.log
         └─ group-ADvsHC_glm.json
Group comparison between patients with Alzheimer’s Disease (group_1 = AD) and healthy subjects (group_2 = HC).
ADvsHC defines the group_label.
The group-ADvsHC_glm.json contains the information for your generalized linear model, for example:
{
    "DesignMatrix": "1 + age + sex + group",
    "StringFormatTSV": "%s %f %f",
    "Contrast": "group",
    "ClusterThreshold": 0.001
}
This file describes the model that you want to create, you should include the factor and covariates in your generalized linear model as a column name in this TSV file.
For example, the linear model formula is: CorticalThickness = 1 + age + sex + group, the contrasts (factors) group, age and sex are the covariates.
Additional information is included in the log file.
The content of group-ADvsHC_participants.tsv is:
participant_id   session_id   sex      group   age
sub-CLNC0001     ses-M000      Female   CN      71.1
sub-CLNC0002     ses-M000      Male     CN      81.3
sub-CLNC0003     ses-M000      Male     CN      75.4
sub-CLNC0004     ses-M000      Female   CN      73.9
sub-CLNC0005     ses-M000      Female   AD      64.1
sub-CLNC0006     ses-M000      Male     AD      80.1
sub-CLNC0007     ses-M000      Male     AD      78.3
sub-CLNC0008     ses-M000      Female   AD      73.2
(Note that to make the display clearer, the rows contain successive tabs, which should not happen in an actual TSV file.)
The <group_id> key/value stands for the group_label for your analysis.
It can be used to run different analyses for different subjects or different analyses for the same subjects.
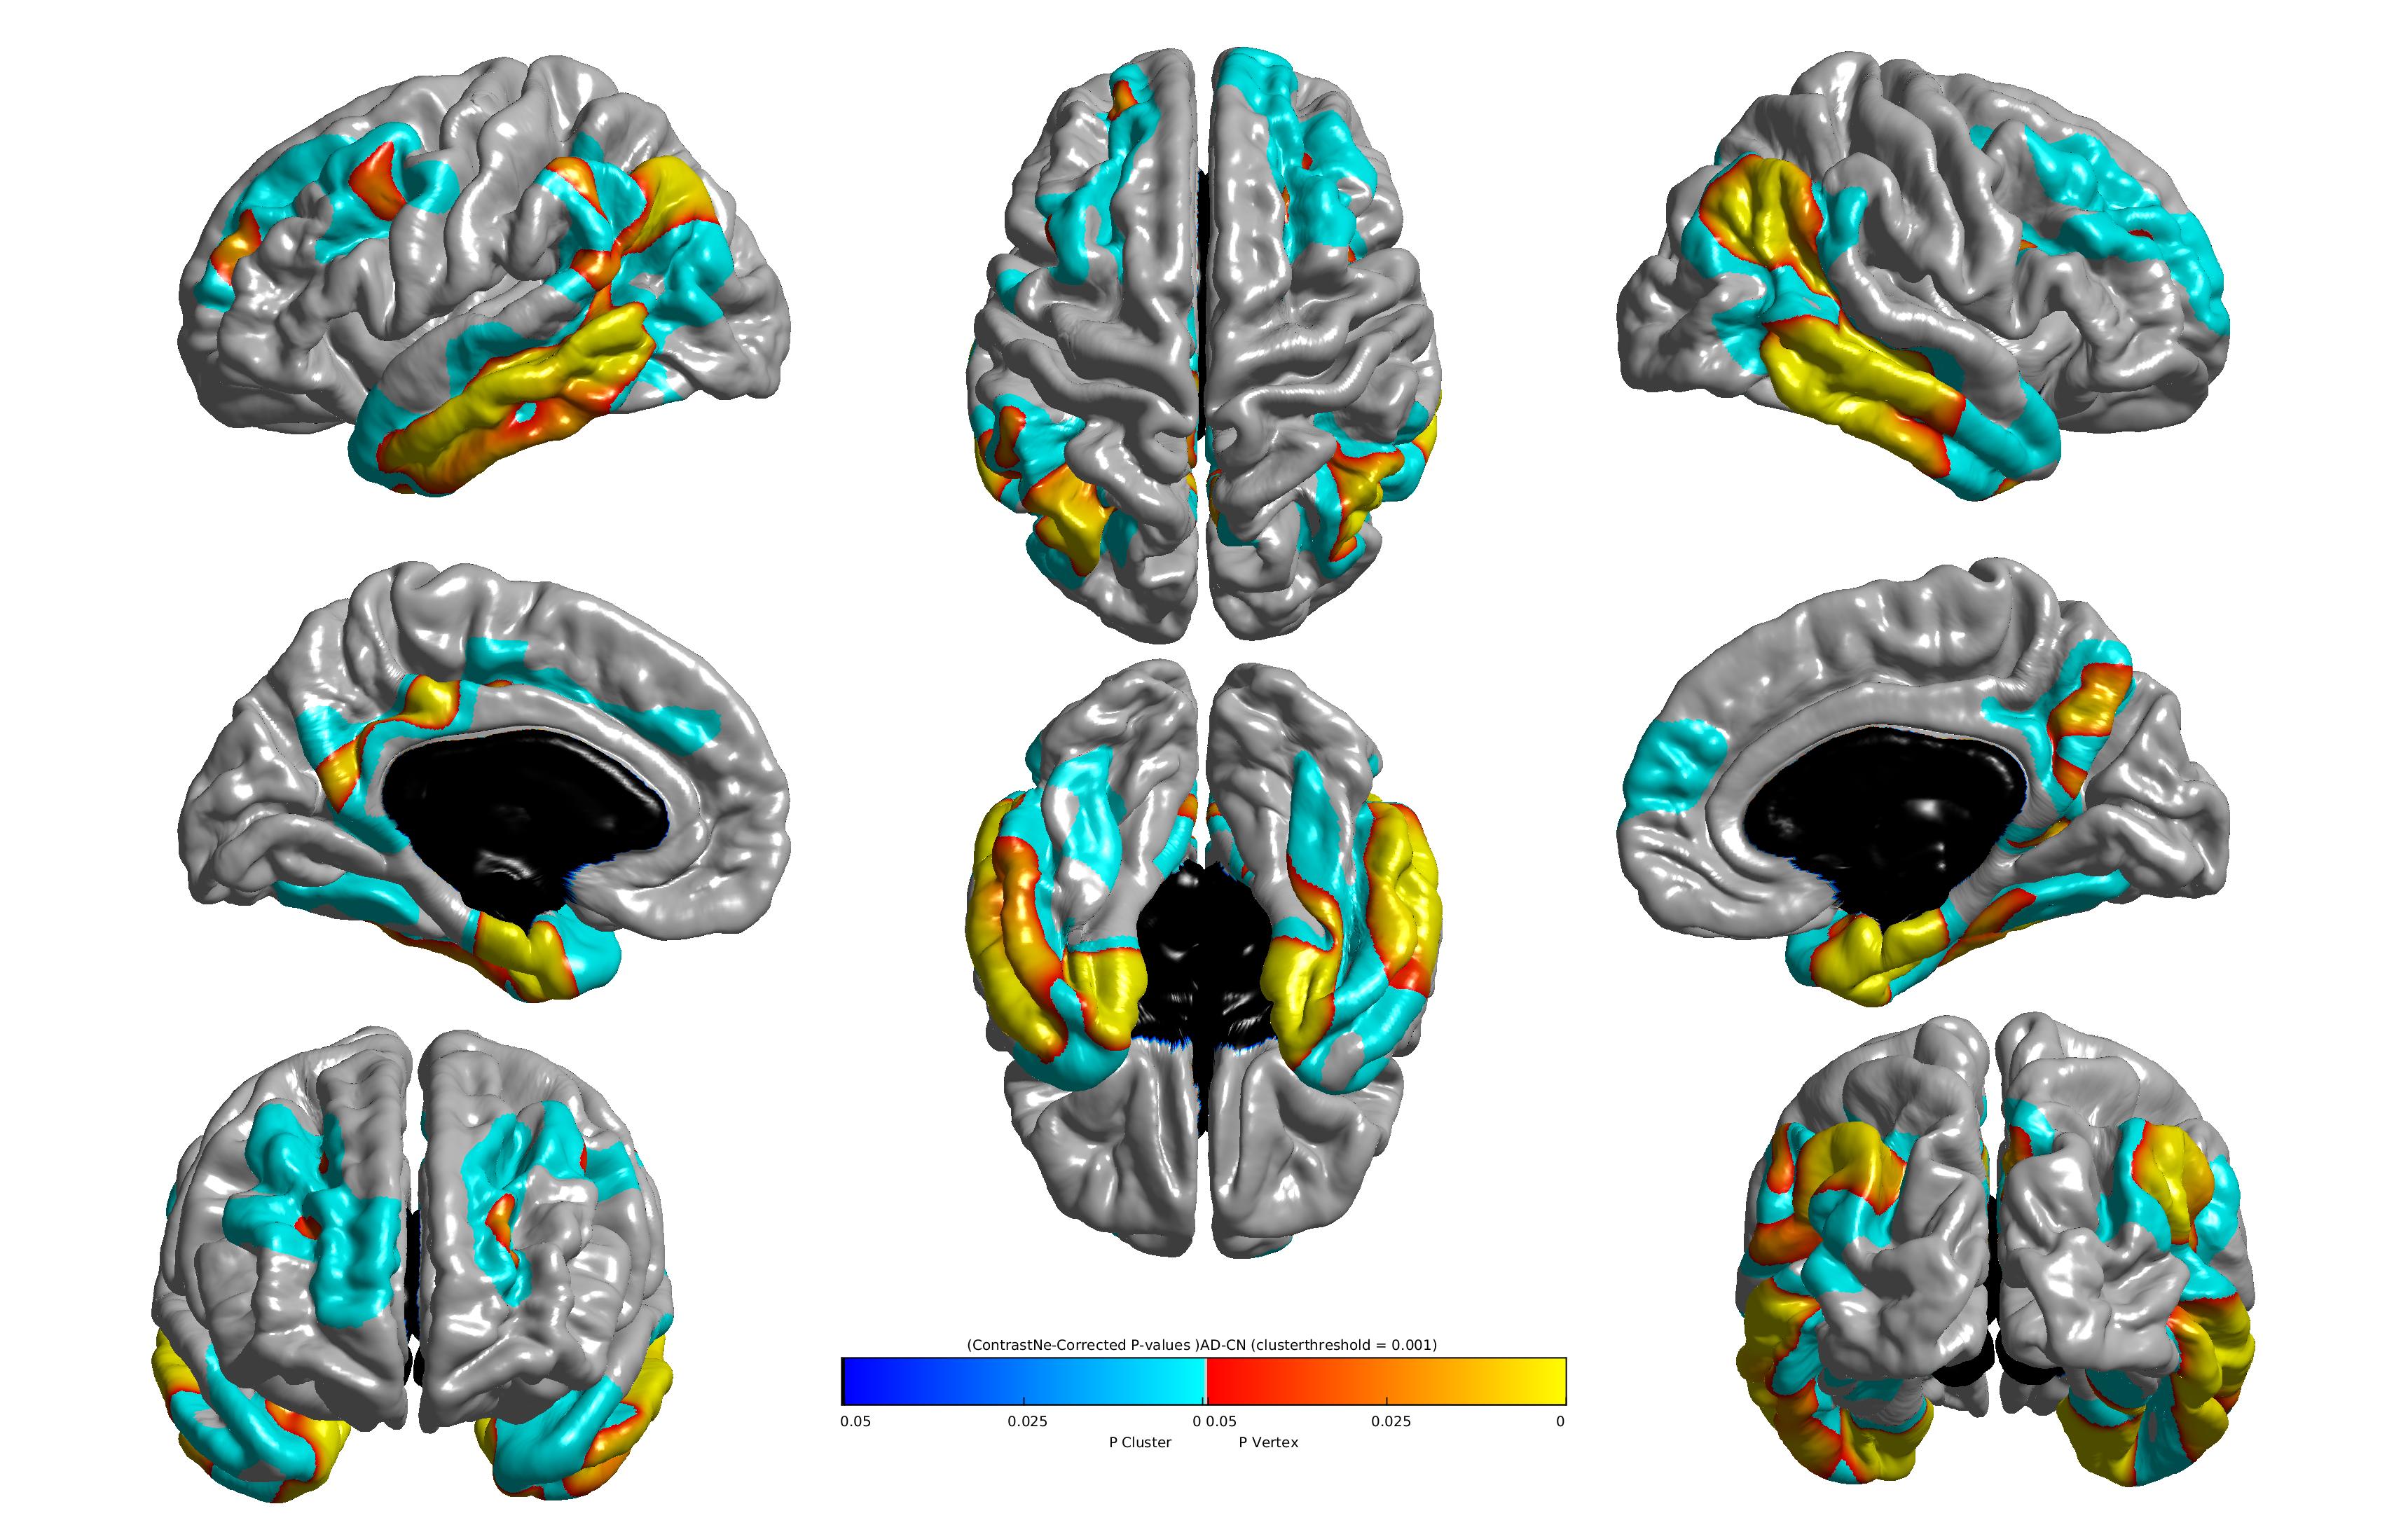
The example image here maps statistically significant differences in cortical thickness between a group of patients with Alzheimer’s disease and a group of healthy controls (yellow: correction at the vertex level; blue: correction at the cluster level).
Correlation analysis
dataset_description.json
groups/
└─ <group_id>/
   └─ statistics/
      ├─ participants.tsv
      └─ surfstat_correlation_analysis/
         ├─ <group_id>_correlation-<label>_contrast-{negative|positive}_measure-<measure>_fwhm-<label>_correctedPValue.jpg
         ├─ <group_id>_correlation-<label>_contrast-{negative|positive}_measure-<measure>_fwhm-<label>_correctedPValue.mat
         ├─ <group_id>_output.log
         ├─ <group_id>_participants.tsv
         └─ <group_id>_glm.json
- The
correlation-<label>here describes the factor of the model which can be, for example,age. - The
contrast-{negative|positive}is the sign of the correlation you want to study, which can benegativeorpositive. - All other key/value pairs are defined in the same way as in the previous section.
statistics-volume - Volume-based mass-univariate analysis with SPM
dataset_description.json
groups/
└─ <group_id>/
   ├─ <group_id>_participants.tsv
   └─ statistics_volume/
      └─ group_comparison_measure-{graymatter|18FFDG|18FAV45|<custom_user>}/
         ├─ <group_id>_{RPV|mask}.nii
         ├─ <group_id>_covariate-<covariate>_measure-<label>_fwhm-<n>_regressionCoefficient.nii
         ├─ <group_id>_<group_1>-lt-<group_2>_measure-<label>_fwhm-<n>_{TStatistics|contrast}.nii
         ├─ <group_id>_<group_2>-lt-<group_1>_measure-<label>_fwhm-<n>_{TStatistics|contrast}.nii
         ├─ <group_id>_report-1.png
         ├─ <group_id>_report-2.png
         └─ <group_id>_{mask|RPV|VarianceError}.nii
Suffixes are described in the table below:
| Name | Suffix | Description |
|---|---|---|
| T-statistics | _TStatistics |
T statistics for a generalized linear model |
| Resels per voxels | _RPV |
Image of the estimated resels per voxels (known as RPV.nii in SPM) |
| Variance of the error | _VarianceError |
Image of the variance of the error (known as ResMS.nii in SPM) |
| Weighted parameters | _contrast |
Image of the estimated weighted parameters (known as con_000X.nii in SPM) |
| Regression coefficient | _regressionCoefficient |
Image of the estimated regression coefficient for beta_000X.nii in SPM) |
| Report | _report-{1|2} |
SPM report containing FWE/FDR peak/cluster thresholds to report for subsequent corrections |
The <group_1>-lt-<group_2> means that the tested hypothesis is: "the measurement of <group_1> is lower than (lt) that of <group_2>".
The value for measure can be graymatter (output of t1-volume), 18FFDG or 18FAV45 (output of pet-volume), or user-defined maps.
The value for fwhm corresponds to the size of the volume-based smoothing in mm.
Corrected results are stored under the following hierarchy:
dataset_description.json
groups/
└─ <group_id>/
   └─ statistics_volume/
      └─ group_comparison_measure-<label>/
         └─ <group_id>_<group_1>-lt-<group_2>_measure-<label>_fwhm-<n>_{FDRc|FDRp|FWEc|FWEc}
            ├─ <group_id>_<group_1>-lt-<group_2>_measure-<label>_fwhm-<n>_desc-{FDRc|FDRp|FWEc|FWEc}_axis-{x|y|z}_TStatistics.png
            └─ <group_id>_<group_1>-lt-<group_2>_measure-<label>_fwhm-<n>_desc-{FDRc|FDRp|FWEc|FWEc}_GlassBrain.png
FWEp(resp.FDRp) corresponds to correction for multiple comparisons with family-wise error (FWE) (resp. false discovery rate [FDR]) correction at the peak (=voxel) level with a statistical threshold of P < 0.05.FWEc(resp.FDRc) corresponds to correction for multiple comparisons with family-wise error (FWE) (resp. false discovery rate [FDR]) correction.
A statistical threshold of P < 0.001 was first applied (height threshold). An extent threshold of P < 0.05 corrected for multiple comparisons was then applied at the cluster level.
Machine Learning
machinelearning-prepare-spatial-svm - Prepare input data for spatially regularized SVM
dataset_description.json
subjects/
└─ <participant_id>/
   └─ <session_id>/
      └─ machine_learning/
         └─ input_spatial_svm/
            └─ <group_id>/
               ├─ <source_file_t1w>_segm-{graymatter|whitematter|csf}_space-Ixi549Space_modulated-on_spatialregularization.nii.gz
               └─ <source_file_pet>_space-Ixi549Space[_pvc-rbv]_suvr-<suvr>_spatialregularization.nii.gz
dataset_description.json
groups/
└─ <group_id>/
   └─ machine_learning/
      └─ input_spatial_svm/
         ├─ <group_id>_space-Ixi549Space_gram.npy
         └─ <group_id>_space-Ixi549Space_parameters.json
At the subject level, it contains SVM regularization of gray matter/white matter/CSF maps or PET data that accounts for the spatial and anatomical structure of neuroimaging data.
At the group level, it contains the Gram matrix with respect to gray matter/white matter/CSF maps needed for the SVM regularization and the information regarding the regularization. An example of JSON file is:
{
    "MaxDeltaT": "0.0025",
    "Alpha": "0.0025",
    "Epsilon": "10E-6",
    "BoundaryConditions": "TimeInvariant",
    "SigmaLoc": "10",
    "TimeStepMax": "0.07760115580830161",
    "SpatialPrior": "Tissues (GM,WM,CSF)",
    "RegularizationType": "Fisher",
    "FWHM": "4"
}
Appendix - Content of a statistic file
<source_file>_space-<space>_map-<map>_statistics.tsv
Statistic file for a given atlas. The TSV file summarizes regional volumes or averages for a given parametric map. With the help of pandas (Python library), it can be easily parsed for machine learning purposes.
Possible values for _map-<map> key/value are:
- For T1:
graymatter(gray matter),whitematter(white matter),csf(CSF) andct(cortical thickness) - For DWI:
FA(fractional anisotropy),MD(mean diffusivity, also called apparent diffusion coefficient),AD(axial diffusivity),RD(radial diffusivity),NDI(neurite density index),ODI(orientation dispersion index) andFWF(free water fraction). - For PET:
18FFDG(18F-Fluorodeoxyglucose),18FAV45(18F-Florbetapir),18FAV1451(18F-Flortaucipir),11CPIB(11C-Pittsburgh Compound-B),18FFBB(18F-Florbetaben) and18FFMM(18F-Flutemetamol).
Example
Content of sub-CLNC01_ses-M000_T1w_space-Hammers_map-graymatter_statistics.tsv:
index   label_name          mean_scalar
0.0     Background          0.0011357992189
1.0     Left Hippocampus    0.576250553131
2.0     Right Hippocampus   0.681780695915
3.0     Left Amygdala       0.577247679234
...
(Note that to make the display clearer, the rows contain successive tabs, which should not happen in an actual TSV file.)
Contact us !
- Check for past answers on Clinica Google Group
- Start a discussion on GitHub
- Report an issue on Github